ESSE news
Blog
Insurance costs continue to rise for truckers
-
Accident rates are on the rise, and so are insurance premiums. According to the American Transportation Research Institute , insurance premium costs per mile increased overall by 47% over the last 10 years, from $0.059 to $0.087. But accidents are not the only factor in rising insurance premiums; there are also rising medical and litigation costs, nuclear verdicts, catastrophic (CAT) losses, reinsurance costs, a higher percentage of inexperienced truckload capacity entering the market, and lastly, the economic performance (underwriting profits) of the insurance industry itself.
- :
//essebrokerage.com/art/wp-content/uploads/2017/05/insurance-costs-300×157.png” alt=”” width=”300″ height=”157″ />
The latter point plays a more significant role than most would have you believe. Just like the trucking industry, the commercial automotive insurance market is cyclical, and right now, we’re in what’s called a “hard market.” For truckload carriers, understanding the differences and what to expect is essential as these cycles affect the availability, terms, and price of commercial insurance (part of the Property & Casualty line of business).
What’s the difference between a soft and hard insurance market?
A soft market, or buyer’s market, is characterized by stable or even lowering premiums, broader terms of coverage, increased capacity, higher available liability limits, easier access to excess layers of liability, and competition among insurance carriers for new business. A hard market, or seller’s market, is characterized by increased premium costs for insureds, stricter underwriting criteria, less capacity, restricted terms of coverage, and less competition among insurance carriers for new business.
Why has commercial auto insurance been so unprofitable for so long?
According to, the increase in losses and expenses are responsible for the Property & Casualty (P&C) sector’s $4.1 billion net underwriting loss in 2021. The accident year combined ratio for the industry was 100.5%. That means the insurance industry paid $1.05 for every premium dollar received. Over the last 43 years, the combined average is just under 104%. The combined loss ratio measures underwriting profitability and reflects the percentage of each premium dollar an insurance company puts toward spending on claims and expenses. Insurance companies generally do not generate profits from their underwriting operations – they also generate income through investments, including stocks, bonds, mortgages, and real estate. When interest rates are high as they are now, investment returns are typically higher, allowing insurance companies to make up underwriting losses through their investment income.
How has the insurance industry gotten this so wrong for so long?
Commercial auto is plagued by incorrect accident descriptors and unpriced severity as to why it’s traditionally an unprofitable underwriting portfolio. Take single-vehicle “hit guard rail” and “wrecker” accident descriptions, for example. In most cases, both are lane departures at roughly four degrees from the lane center. The cause? In most cases, a four-degree lane drift occurs after the driver falls asleep and drifts off the road, so you can see that unless the accident loss run used by the underwriter includes the actual cause of the accidents (in these examples, sleep deprivation), they miss both the solution and pricing of nuclear verdict probability result from significant losses. The reason is straightforward. Because underwriters base portfolio performance on the description of accidents and not cause, they cannot factor in the randomness of single-vehicle accidents.
Unlike a low-cost fender-bender where the driver makes a mistake and attempts to minimize damage at the point of impact, in a single-vehicle accident where the driver is asleep at the point of impact, the outcome is entirely random. It could be a “hit guard rail” or “wrecker,” but in a different location, a few hundred feet up the road, it could be a school bus or church in the way of the out-of-control truck.
Most underwriters believe the radius of operation, tenure of the driver, and the number of accidents a fleet has to be major drivers of risk when in reality, it’s the time of day driving occurs that drives accident severity the most. And because most insurers ignore the time of day despite electronic logging devices having all the data they need, they’re unable to see a fleet’s accident severity risk because they are looking at the wrong risk factors.
How much have insurance premiums risen, and what’s the 2023 forecast?
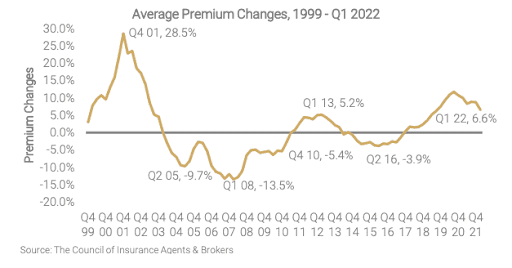
According to The Council of Insurance & Brokers in their Commercial Property & Casualty Q1/2022 report, “premiums increased for the 18th consecutive quarter in Q1 2022, with respondents reporting an average premium increase across all account sizes of 6.6% (see Figure 1). However, the rate at which premium prices increased moderated slightly in Q1 2022, with most lines showing lower increases than Q4 2021 by at least two percentage points or more.”
What can carriers do to reduce the cost of insurance?
The first thing is to code accidents by what caused them and not by describing what happened. Determining the cause can be somewhat subjective and takes an experienced person to reach a solid conclusion. But in doing so, the fleet can address the root cause rather than the symptoms and this in part explains why severe accidents involving large trucks are getting worse, not better. The reason is that the majority of underwriters, loss control, and safety managers are looking in the wrong place for answers.
The second thing to do would be to begin managing the cause of accident risk and not the cost of insurance. Reducing excess coverage and increasing deductibles and self-insured retention (SIR) levels will not sustain insurance premiums if the underlying risk is not addressed. And because around 80% of claims costs are caused by 10-12% of accidents (mostly single-vehicle lane departures), knowing what caused the 10-12% is the place to start, not with the description of what happened.
Information provided from dat.com


